
Your channel is chugging along well, your subscriber count is growing by the day, and you keep creating great content. That’s wonderful — but when it’s time to level up your strategy, what metrics do you need to look at, and what do you do afterwards? Here’s where to start:
Subscriber growth.
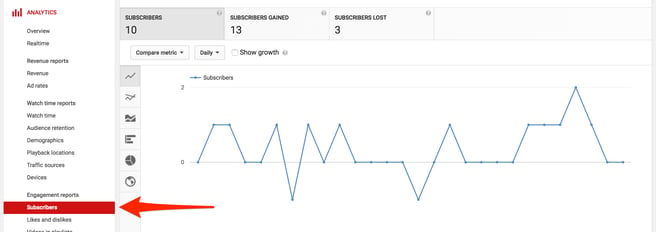
What it is and where it’s at: Obviously, you know how many subscribers you have — but do you know when they joined you? By clicking on “Subscribers” underneath the “Engagement reports” header, you’ll see a graph of subscriber growth over time. You can change the time period at the top, so that you’re looking at growth/loss over the last 90 days, 6 months, etc. By scrolling underneath the graph, you’ll see a breakdown of the growth/loss by where it came from (unsubscribing while watching a video or on your channel, or due to a closed account, for example).
What you can learn from it: Subscribers will join and drop off over time on their own, but if you see a big spike in new subscribers, it’s worth digging into. You can look at whether those subscribers all found you from the same video (and if so, which video it was, if that video was embedded on a new site, and so on) and learn from that. If one of your videos netted you an unusual amount of new subscribers, it’s worth making new videos like it. Similarly, if the boost in subscribers came because the video was embedded on a site, it’s worth looking at the site and learning more about its audience (and what that says about people interested in your video), and reaching out to the site owner to see about potential collaborations.
Traffic sources.
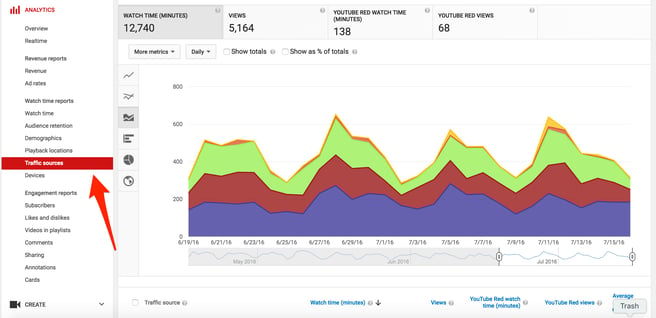
What it is and where it’s at: “Traffic sources,” underneath “Watch time reports,” tells you where people are finding your videos. The graph you’ll see breaks down traffic sources by color, and underneath that, you’ll find in-depth data.
What you can learn from it: It’s good to have an idea of how new viewers are finding you, but it’s particularly interesting to look at the external sources. By clicking on it, you can see what sites your videos have been embedded on, and how many views came from each site. Similar to the suggestion in the section on subscriber growth, if you find that a site has featured one of your videos, it’s a great opportunity to reach out to the site, thank them for featuring your content, and see about potential future collaborations.
Average view duration.
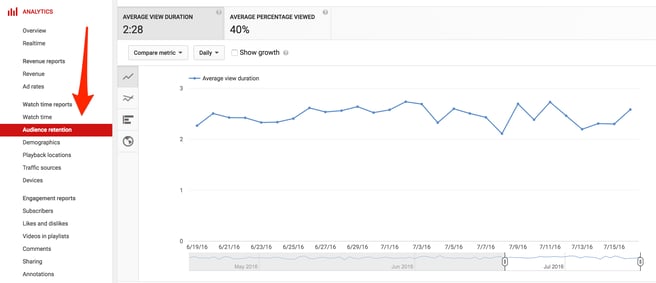
What it is and where it’s at: You can look at average view duration across all of your videos, or average view duration for a particular video. Under the video manager, you can click on “Analytics” and then “Audience retention.” The next screen will show you average view duration across all videos, and if you scroll down, you’ll see the average view duration for each of your videos underneath it.
What you can learn from it: By looking at when people are dropping off from your videos, you can learn what your viewers’ attention spans are like, and add especially engaging content around the drop-off time to keep people from tuning out. For more on average view duration and how to keep viewers engaged, check out our post on getting viewers to watch to the end of your videos.
Devices.
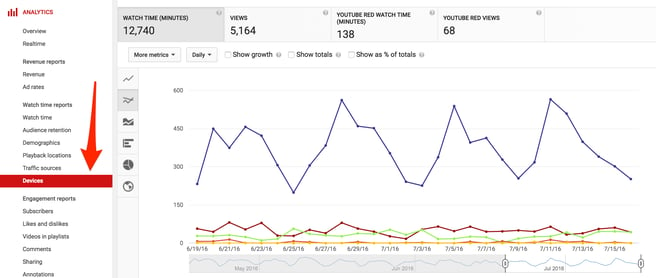
What it is and where it’s at: The “Devices” information is at the bottom of the “Watch time reports” section on the analytics page. When you click on it, you’re taken to a screen where there’s watch time (in minutes) graphed out by device, and scrolling down takes you to a breakdown by computer, mobile phone, tablet, etc., telling you exactly how many views and minutes came from each device.
What you can learn from it: Looking at the kinds of devices that people are watching on gives you clues as to the best way to structure your videos. If people are primarily watching on mobile phones, you need to make sure that any text is large enough to see on a small screen. If they primarily watch on a computer, embedding links in your annotations and cards is great — if they’re mostly watching on a TV, maybe not so much.
Demographics.
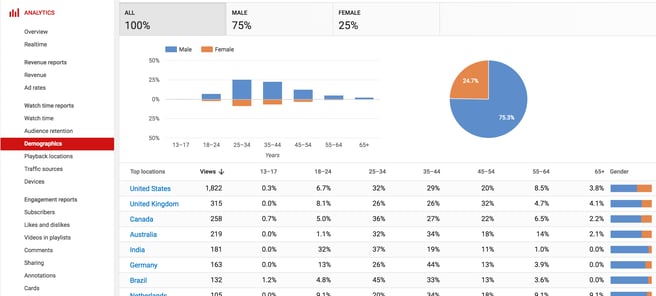
What it is and where it’s at: “Demographics” is also under “Watch time reports.” It’ll show you where viewers are watching from, the gender breakdown of viewers and age groups of viewers. You can also segment these demographics by subscriber vs non-subscriber, and look at people who watch your playlists compared to people who watch your general uploads.
What you can learn from it: No matter how clear you are on your target viewer, it’s always good to have a clue as to who is actually watching your videos, and where your most engaged viewers are living. It can also give you clues as to things you might want to add into your videos — if a lot of your views are coming from non-English speaking countries, for example, it might be a good idea to have subtitles translated and available for people who speak other languages.
This is only scratching the surface (and we’ll be talking about YouTube analytics more in depth in the future, so stay tuned!) but in the meantime, this should be enough to help you create a strategy for making your YouTube channel continue to grow. And as always, if you’d like to continue receiving tips on how to market and grow your influencer business, make sure to sign up for the email list!